- SEIKA Digital Image Corporation.
- ProductList
- Digital Schlieren System (DSS) BOS method, visualization method
- [For quality control] Digital Schlieren System (DSS)
digital schlieren system Inspection equipment, Mura detection Visualize (detect) phenomena that were difficult to visualize until now!
What is a digital schlieren system?
The Digital Schlieren System (DSS) is a type of image measurement method that makes it possible to visualize subtle changes in the refractive index of space.
It is possible to visualize transparent and difficult-to-visualize phenomena such as heat, pressure, and gas.
It is used for visualization of the "drying process", "gas injection process", and "material stirring process" in the manufacturing process.
-
Problem ①
There are phenomena that cannot be visualized (detected) by the inspection equipment and measuring equipment used such as ordinary cameras and light sources.
-
Problem ②
I want to easily visualize rough flow without laser or seeding.
-
Problem ③
I'm using an optical schlieren, but I want to use it more easily and in a wider range.
Problem ①
There are phenomena that cannot be visualized (detected) by the inspection equipment and measuring equipment used such as ordinary cameras and light sources.
Problem ①
There are phenomena that cannot be visualized (detected) by the inspection equipment and measuring equipment used such as ordinary cameras and light sources.
Visualization of transparency phenomenon
If the process you want to observe is a transparency phenomenon, it may be difficult to visualize it with normal equipment. If a refractive index difference occurs inside the phenomenon, it may be possible to visualize the phenomenon using DSS.
The reason why the refractive index difference occurs is as follows.
temperature difference
Heat is used in various manufacturing processes such as heating, cooling, and drying. Since the phenomenon occurs in space, it is difficult to visualize it with thermography. DSS can visualize refractive index changes due to heat distribution in space.
Measurement example: Dryer
You can observe how it circulates inside by spraying a dryer on the water tank. In addition, the DSS image is analyzed again to calculate and display the average vector (flow direction and speed).Measurement example: heat gun
It visualizes the state of the injection of the heat gun. A high-speed camera (1000fps) is used to create highly continuous visualized images.Measurement example: hot plate
It visualizes how air heated from a hot plate rises.Visualization size (720x420mm)
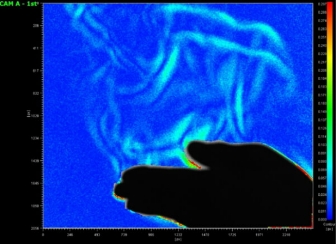
Measurement example: water heater
Visualize the steam rising from the water heater.
gas
When the gas is transparent, it is difficult to visualize the drying volatilization process during material manufacturing and the gas filling process.
With DSS, it is possible to visualize the refractive index change due to gas.
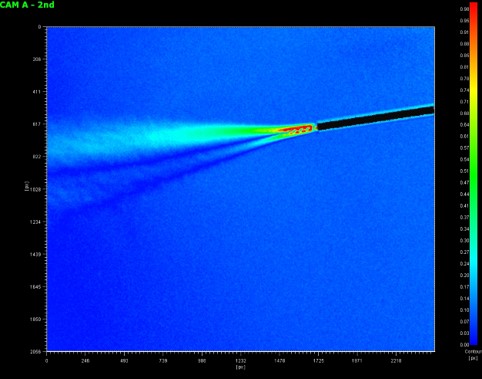
Measurement example: Methane gas
Visualization of methane gas being discharged from the tube.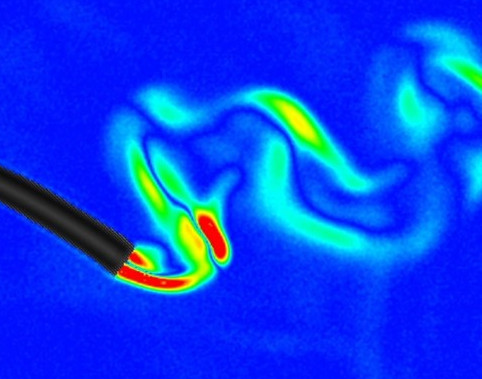
Measurement example: Drying of adhesive
It visualizes the gas generated when the adhesive dries. It looks like the gas is staying at the point of origin.Measurement example: Drying of adhesive
It visualizes the gas generated when the adhesive dries. You can observe how the gas stays where it is generated. Observable.
Measurement example: Carbon dioxide gas
Visualizes the carbon dioxide leaking out when opening a carbonated drink.Foreign matter/alteration
Quality abnormalities (unevenness, deterioration, etc.) may occur in the material during the material manufacturing process.
If the anomaly is transparent, it is difficult to visualize.
In DSS, if the abnormal part has a different refractive index than its surroundings, it is possible to visualize the abnormal part.
Measurement example: deodorant beads melting out
Visualization of transparent deodorant beads dropped into water. You can observe how the solvent dissolves.Measurement example: deodorant beads stirring
Visualization of transparent deodorant beads dropped into water and stirred. You can observe how the solvent dissolves while the beads are stirred.Pressure difference
When a high-speed flow is generated in a small space such as a spray, a pressure difference with the surroundings is generated, but it is difficult to visualize the situation.
With DSS, it is possible to visualize changes in refractive index due to pressure differences.
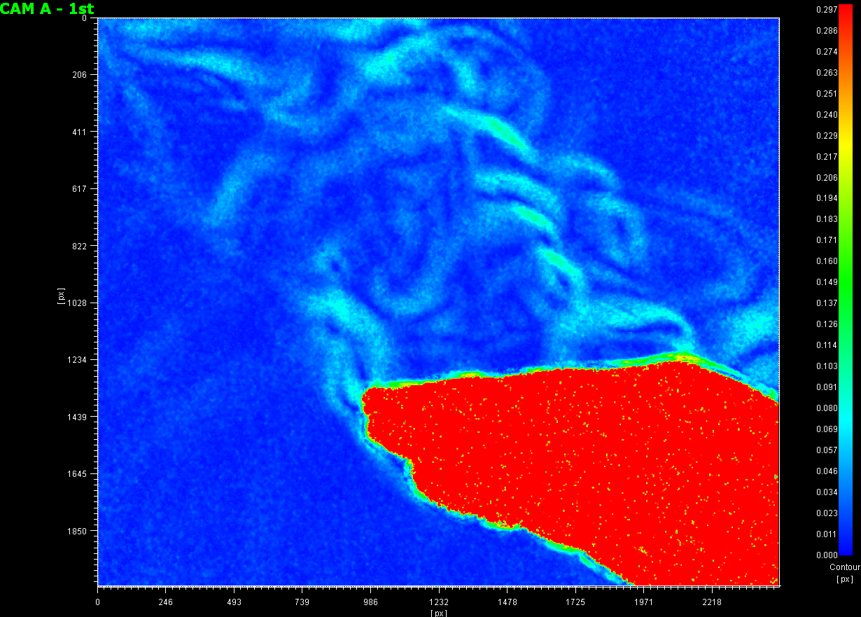
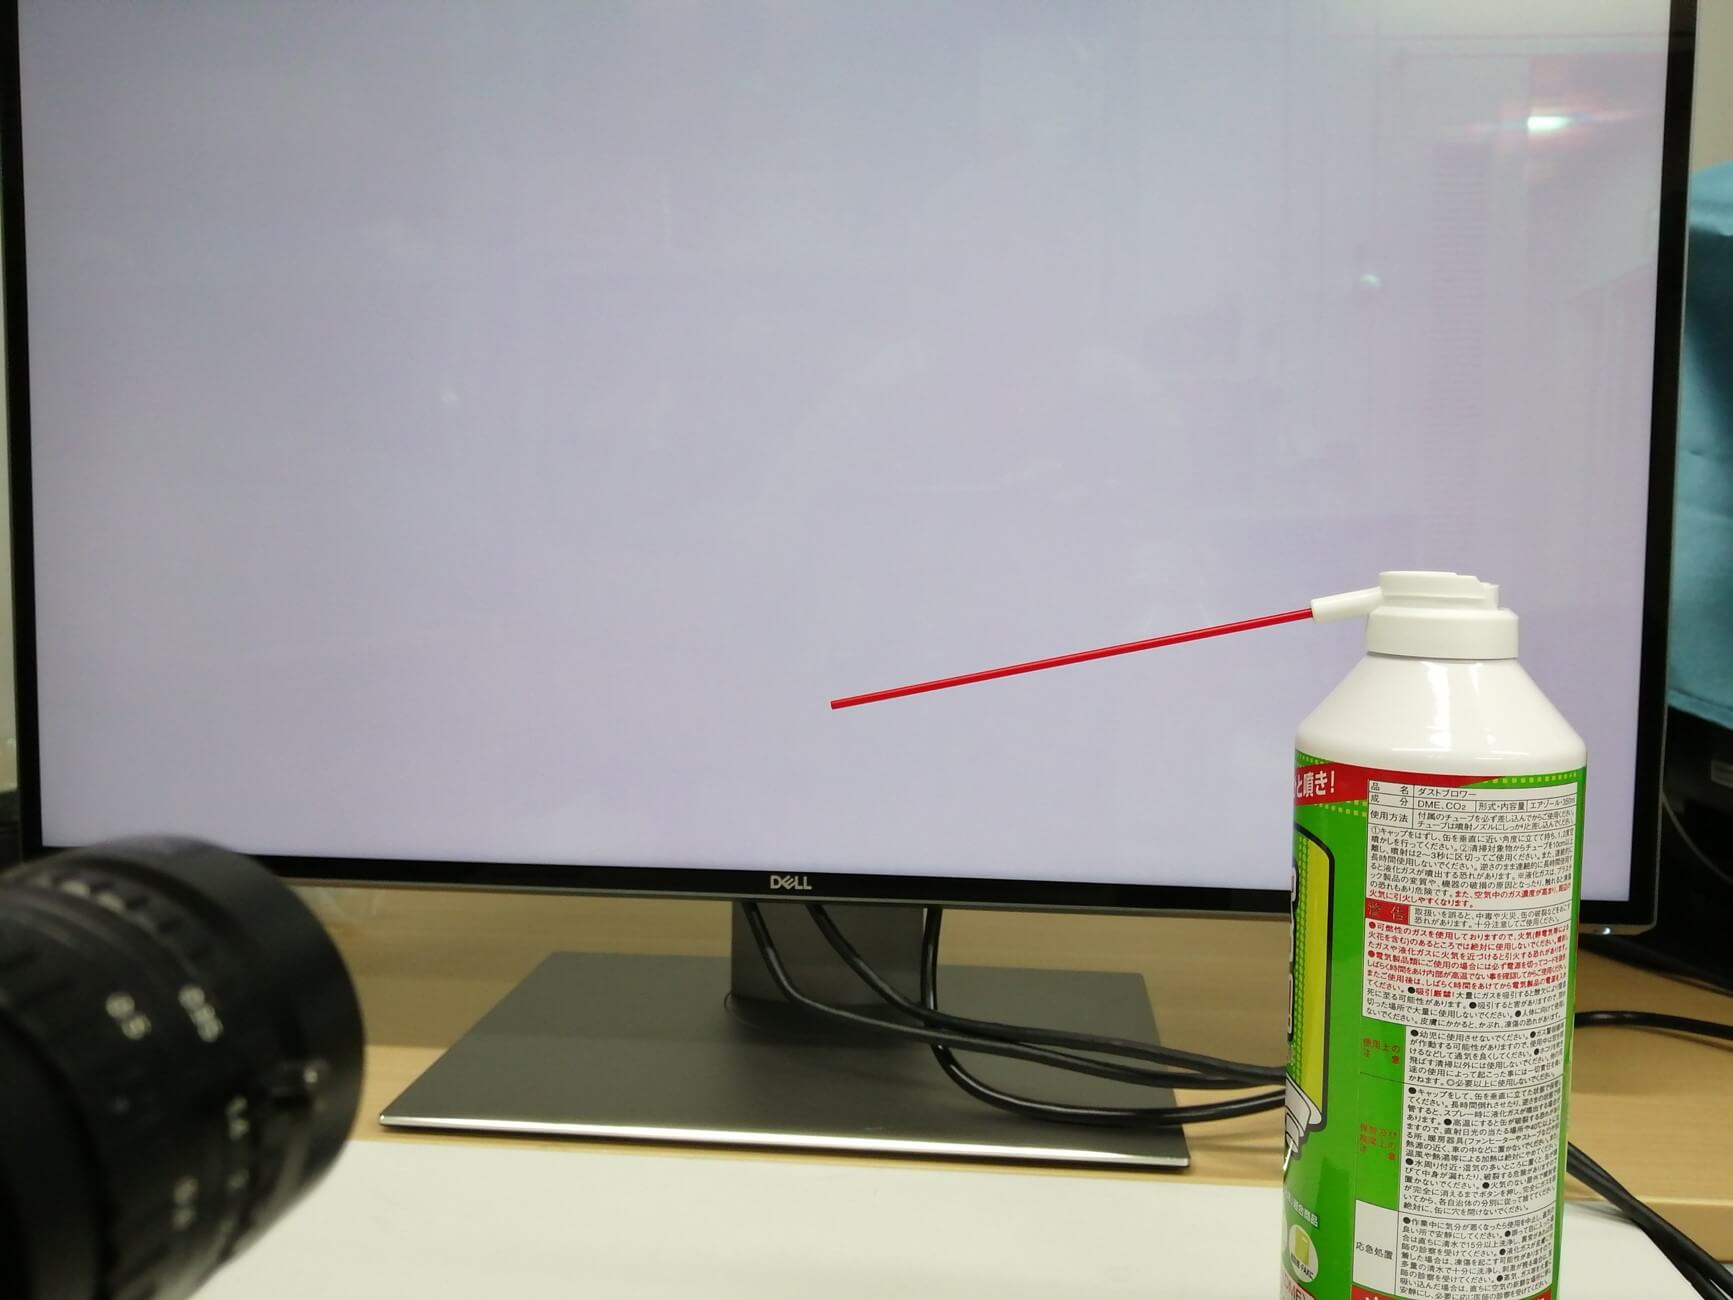
Measurement example: duster
Visualization of gas injection from the duster. Since the injection pressure is high, the pattern caused by the pressure wave can be observed immediately after injection.
Problem ②
I want to easily visualize rough flow without laser or seeding.
Problem ②
I want to easily visualize rough flow without laser or seeding.
Flow field measurement
If the phenomena that generate various refractive index differences such as problem (1) are continuously changing, it is possible to roughly measure the flow field by analyzing the visualization results of DSS.
The advantage is that there is no need to use laser sheets or seeding.
The disadvantage is that it becomes a rough flow analysis of the entire measurement space, and the accuracy of local fine flows is not high.
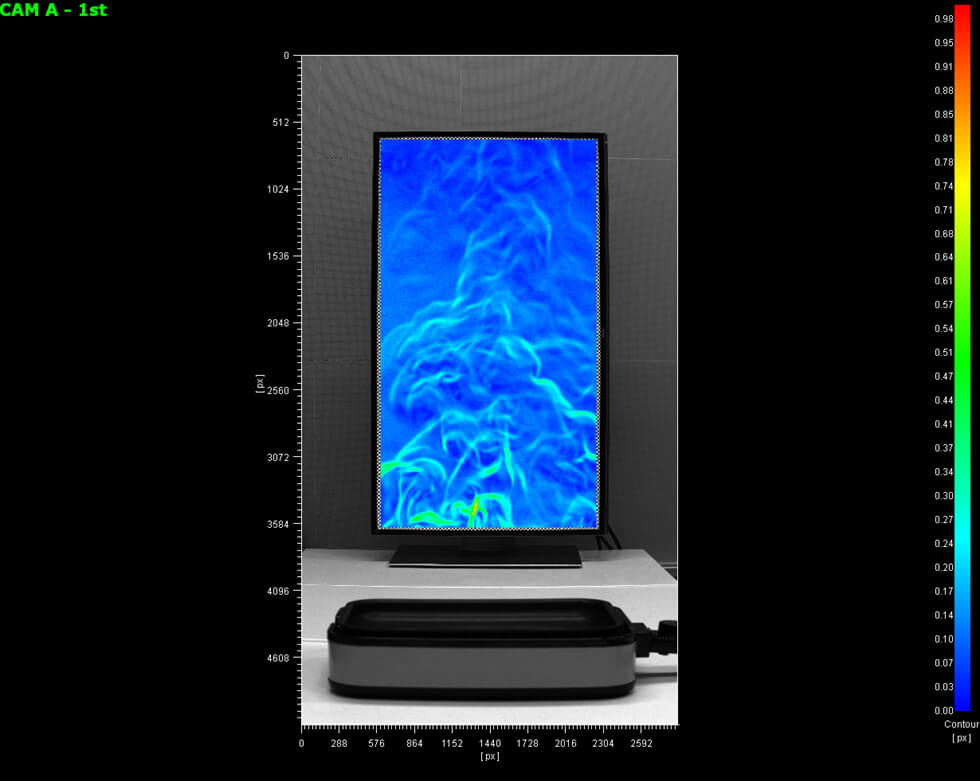
Measurement example: hot plate
It visualizes how air heated from a hot plate rises.
Visualization size (720x420mm)
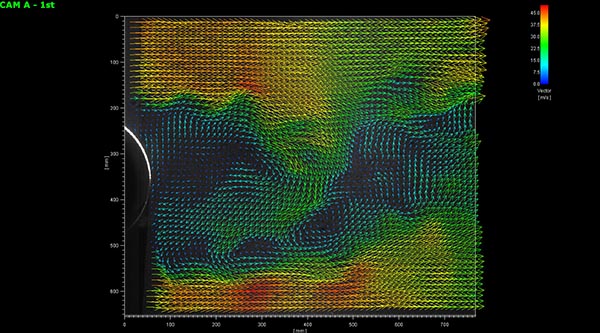
Measurement example: hot plate flow analysis
It is a vector diagram obtained by flow analysis of the data on the left.
Measurement example: dryer flow analysis
You can observe how it circulates inside by spraying a dryer on the water tank. In addition, the DSS image is analyzed again to calculate and display the average vector (flow direction and speed).
Problem ③
I'm using an optical schlieren, but I want to use it more easily and in a wider range.
Problem ③
I'm using an optical schlieren, but I want to use it more easily and in a wider range.
No need for difficult optical axis alignment
Optical schlieren devices use multiple mirrors and lenses to utilize parallel light.
In that case, it was difficult to adjust the optical axis, and the measurement field was limited by the size of the mirror and lens, making it difficult to measure in a wide range.
DSS consists of only a camera, camera lens, dedicated background, and analysis software, and does not require any difficult optical axis alignment.
In addition, it is easy to increase the size of the dedicated background, making it possible to measure more than 1m square.
Measurement example: hot plate
It visualizes how air heated from a hot plate rises.
Visualization size (720x420mm)
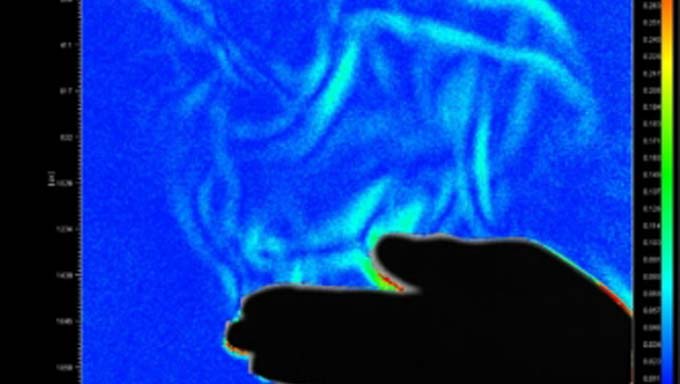
Measurement example: hot plate flow analysis
It visualizes the updraft caused by the heat generated from the hands.
Measurement example: breath
Human breath can be observed. Visualization size (800x800mm)
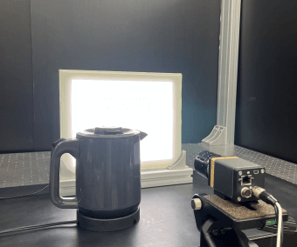
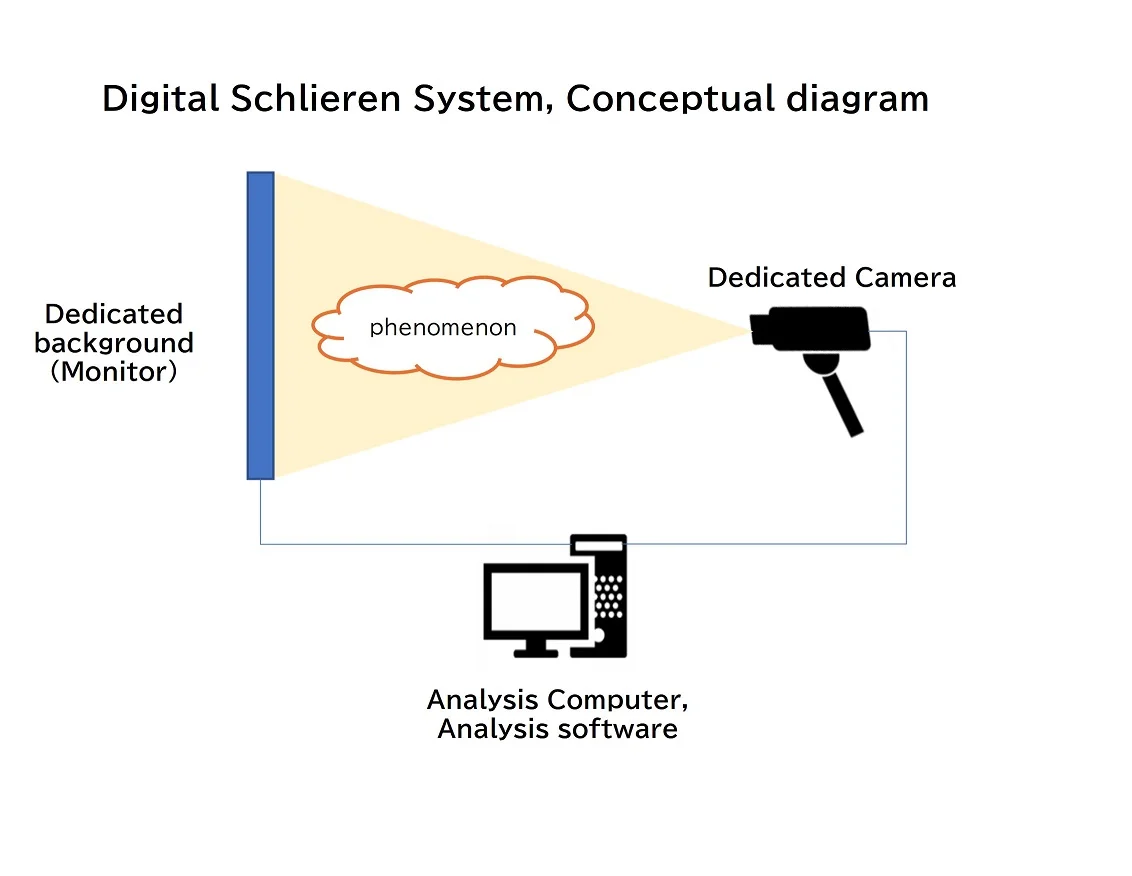
System configuration
- Various cameras (high resolution camera, high resolution high speed camera)
- Dedicated background
- Dedicated analysis software
- Dedicated background creation software
- Control PC
The digital schlieren system is an epoch-making system that can easily capture a wide range of schlieren images without requiring complicated equipment configuration or optical adjustment.